Tools for Data Analysis
Growth curve data analysis
Estimation of populations’ growth is a significant part of research in many fields of biology. This is particularly important in experimental medicine, experimental oncology and drug development. Finding a substance which can specifically destroy or hamper growth of cancer cells while leaving intact normal cells is a primary goal of anti-cancer drug development. This task is extremely complicated since normal and tumour cells are actually quite similar thus resulting in substantial side effects of any anti-cancer treatment. Identifying such substances is done by a number of ways but eventually all successful candidates would need to be tested in a cellular system which model a real situation and will allow to perform a preliminary estimation of specific and non-specific effect of the treatment.
Thus, we are coming to the analysis of cell growth under control conditions and under treatment. Classical way is to treat cell lines with a test substance at different concentrations for 2-3 days and by the end of experiment estimate a number of living cells in the control and treated samples. This give a snapshot of the cell cultures at the endpoint of the experiment. However, such approach misses a lot of valuable information, such as time when changes started to happen in cell culture, whether cells recover after initial impact of the experimental compound and how fast they do it. It will give important information about drug metabolism, emergence of the resistant clones or adaptation of cells to the treatment by deploying the detoxification system which includes drug oxidation, hydroxylation, conjugation, excretion or by activating repair systems, such as DNA repair or other stress adaptive responses helping cells to survive.
Analysis of the growth curves is a complicated mathematical task. We are dealing here with non-linear dependency between time and population density/ cell number/ cell confluency. This relationship is usually described by logistic regression model which is regarded as a good fit to S-shape of the data which comprises in our case lag-phase (cells are adapting to the new conditions after subculture into a new vessel), log-phase (cells are in the exponential growth phase) and stationary phase (culture becomes stabilized due to confluency or lack of nutrients). The full set of data gives information about population doubling time at different stages of the culture, maximum population doubling time, comparison between cultures when population growth reaches it maximum in the control untreated cultures, speed of growth in terms of changes in the confluency or cell number per hour, maximum growth rate, time when the cell growth reaches its maximum etc.
IncuCyte
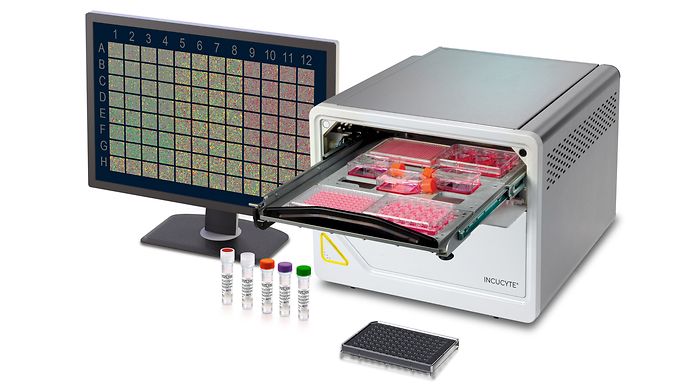
Live imaging technology through a time-lapse photography enables us to estimate conditions of the cell cultures at any point during the experiment. The popular equipment in cell biology to achieve this goal at the present moment is IncuCyte. It provides series of time-lapse phase-contrast and several fluorescent channels images.
Confluency/ cell number
Click on the image will take you to the application I have developed for cell growth curves analysis. The app is written in R Shiny code and it is free to use. Data preparation is described in the application.
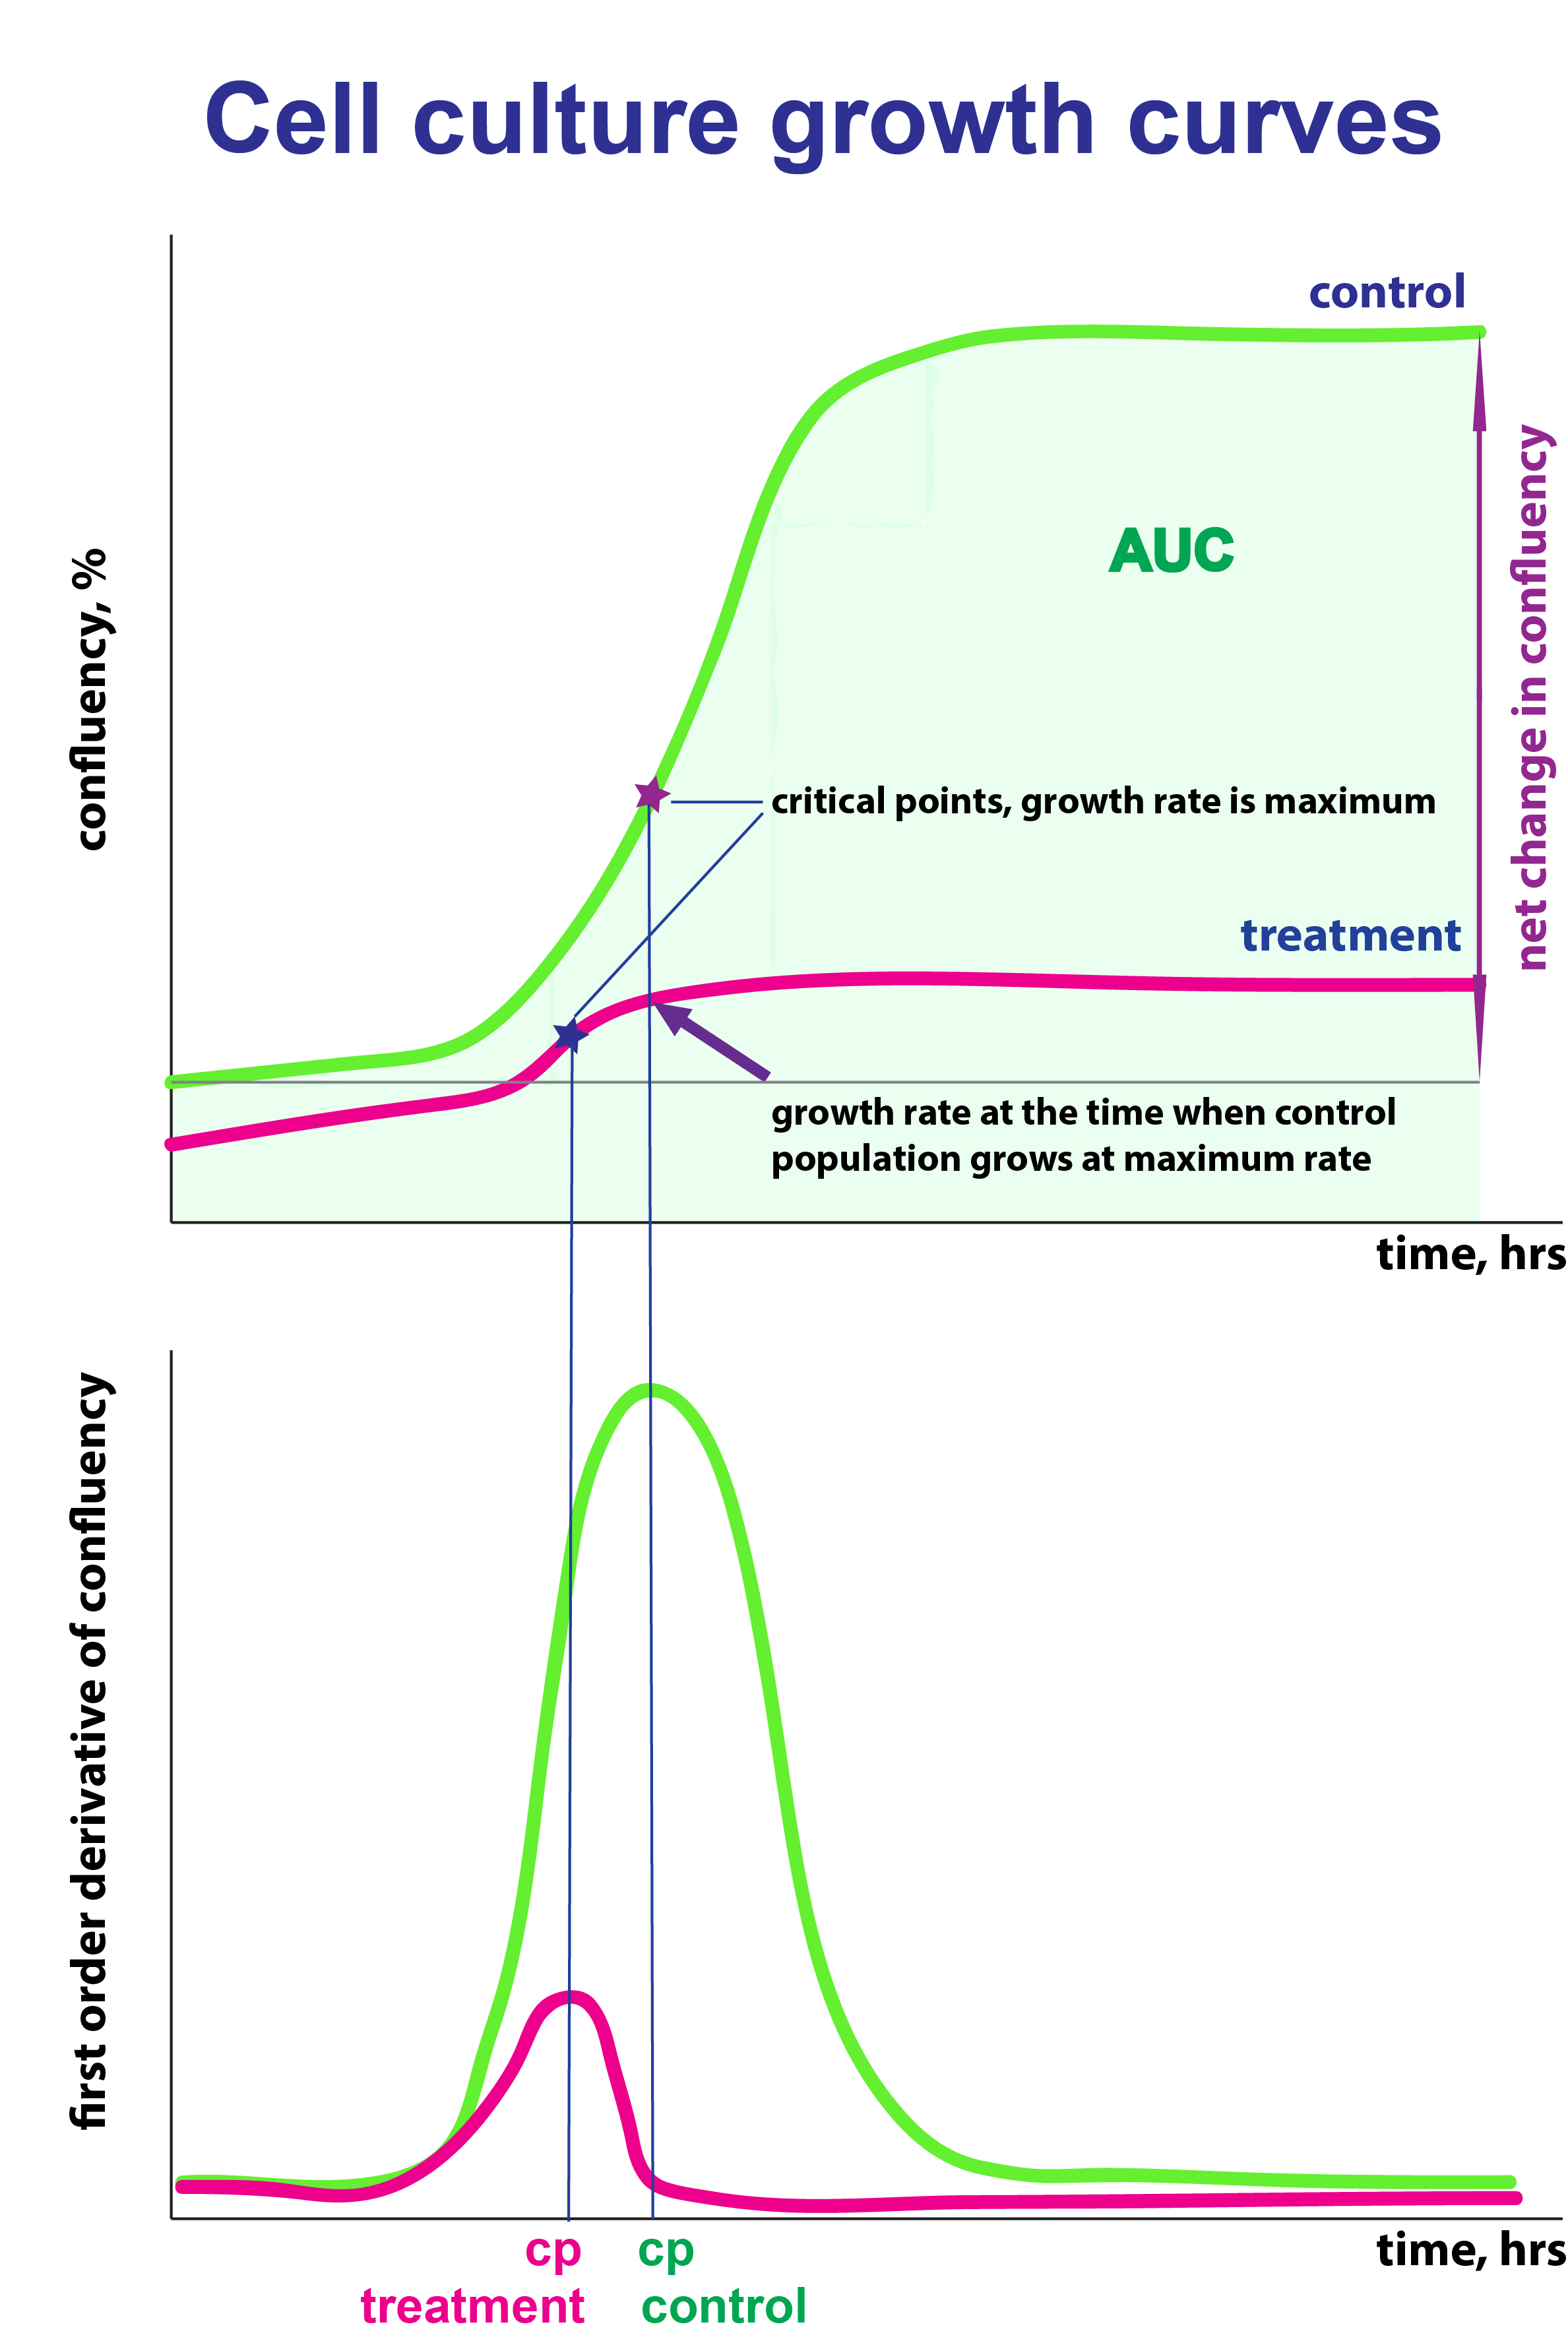
The parameters I recommend to use for data description and comparison:
Rate_cp_ctrl: cell growth rate at the time when growth rate of the control population reaches its maximum (cp). I suggest to use this parameter.
Net.change: a change in cell confluency over time as estimated based on the regression model
Cp: critical point, time(h) when cell growth reaches its maximum rate
Max.rate: maximum rate of cell growth (expressed as % confluency /h)
Max.DT: maximum population doubling time (h)
Fluorescent signal
Click on the image will take you to the application I have developed to analyse induction of a fluorescence signal over time. The app is written in R Shiny code and it is free to use. Data preparation is described inside of the application. The estimation of AUC, area under curve, is done by a spline function model. AUC is an integral estimation of cellular exposure to the measured signal over time. Here it is expressed in (fluorescent signal /confluency) x time.
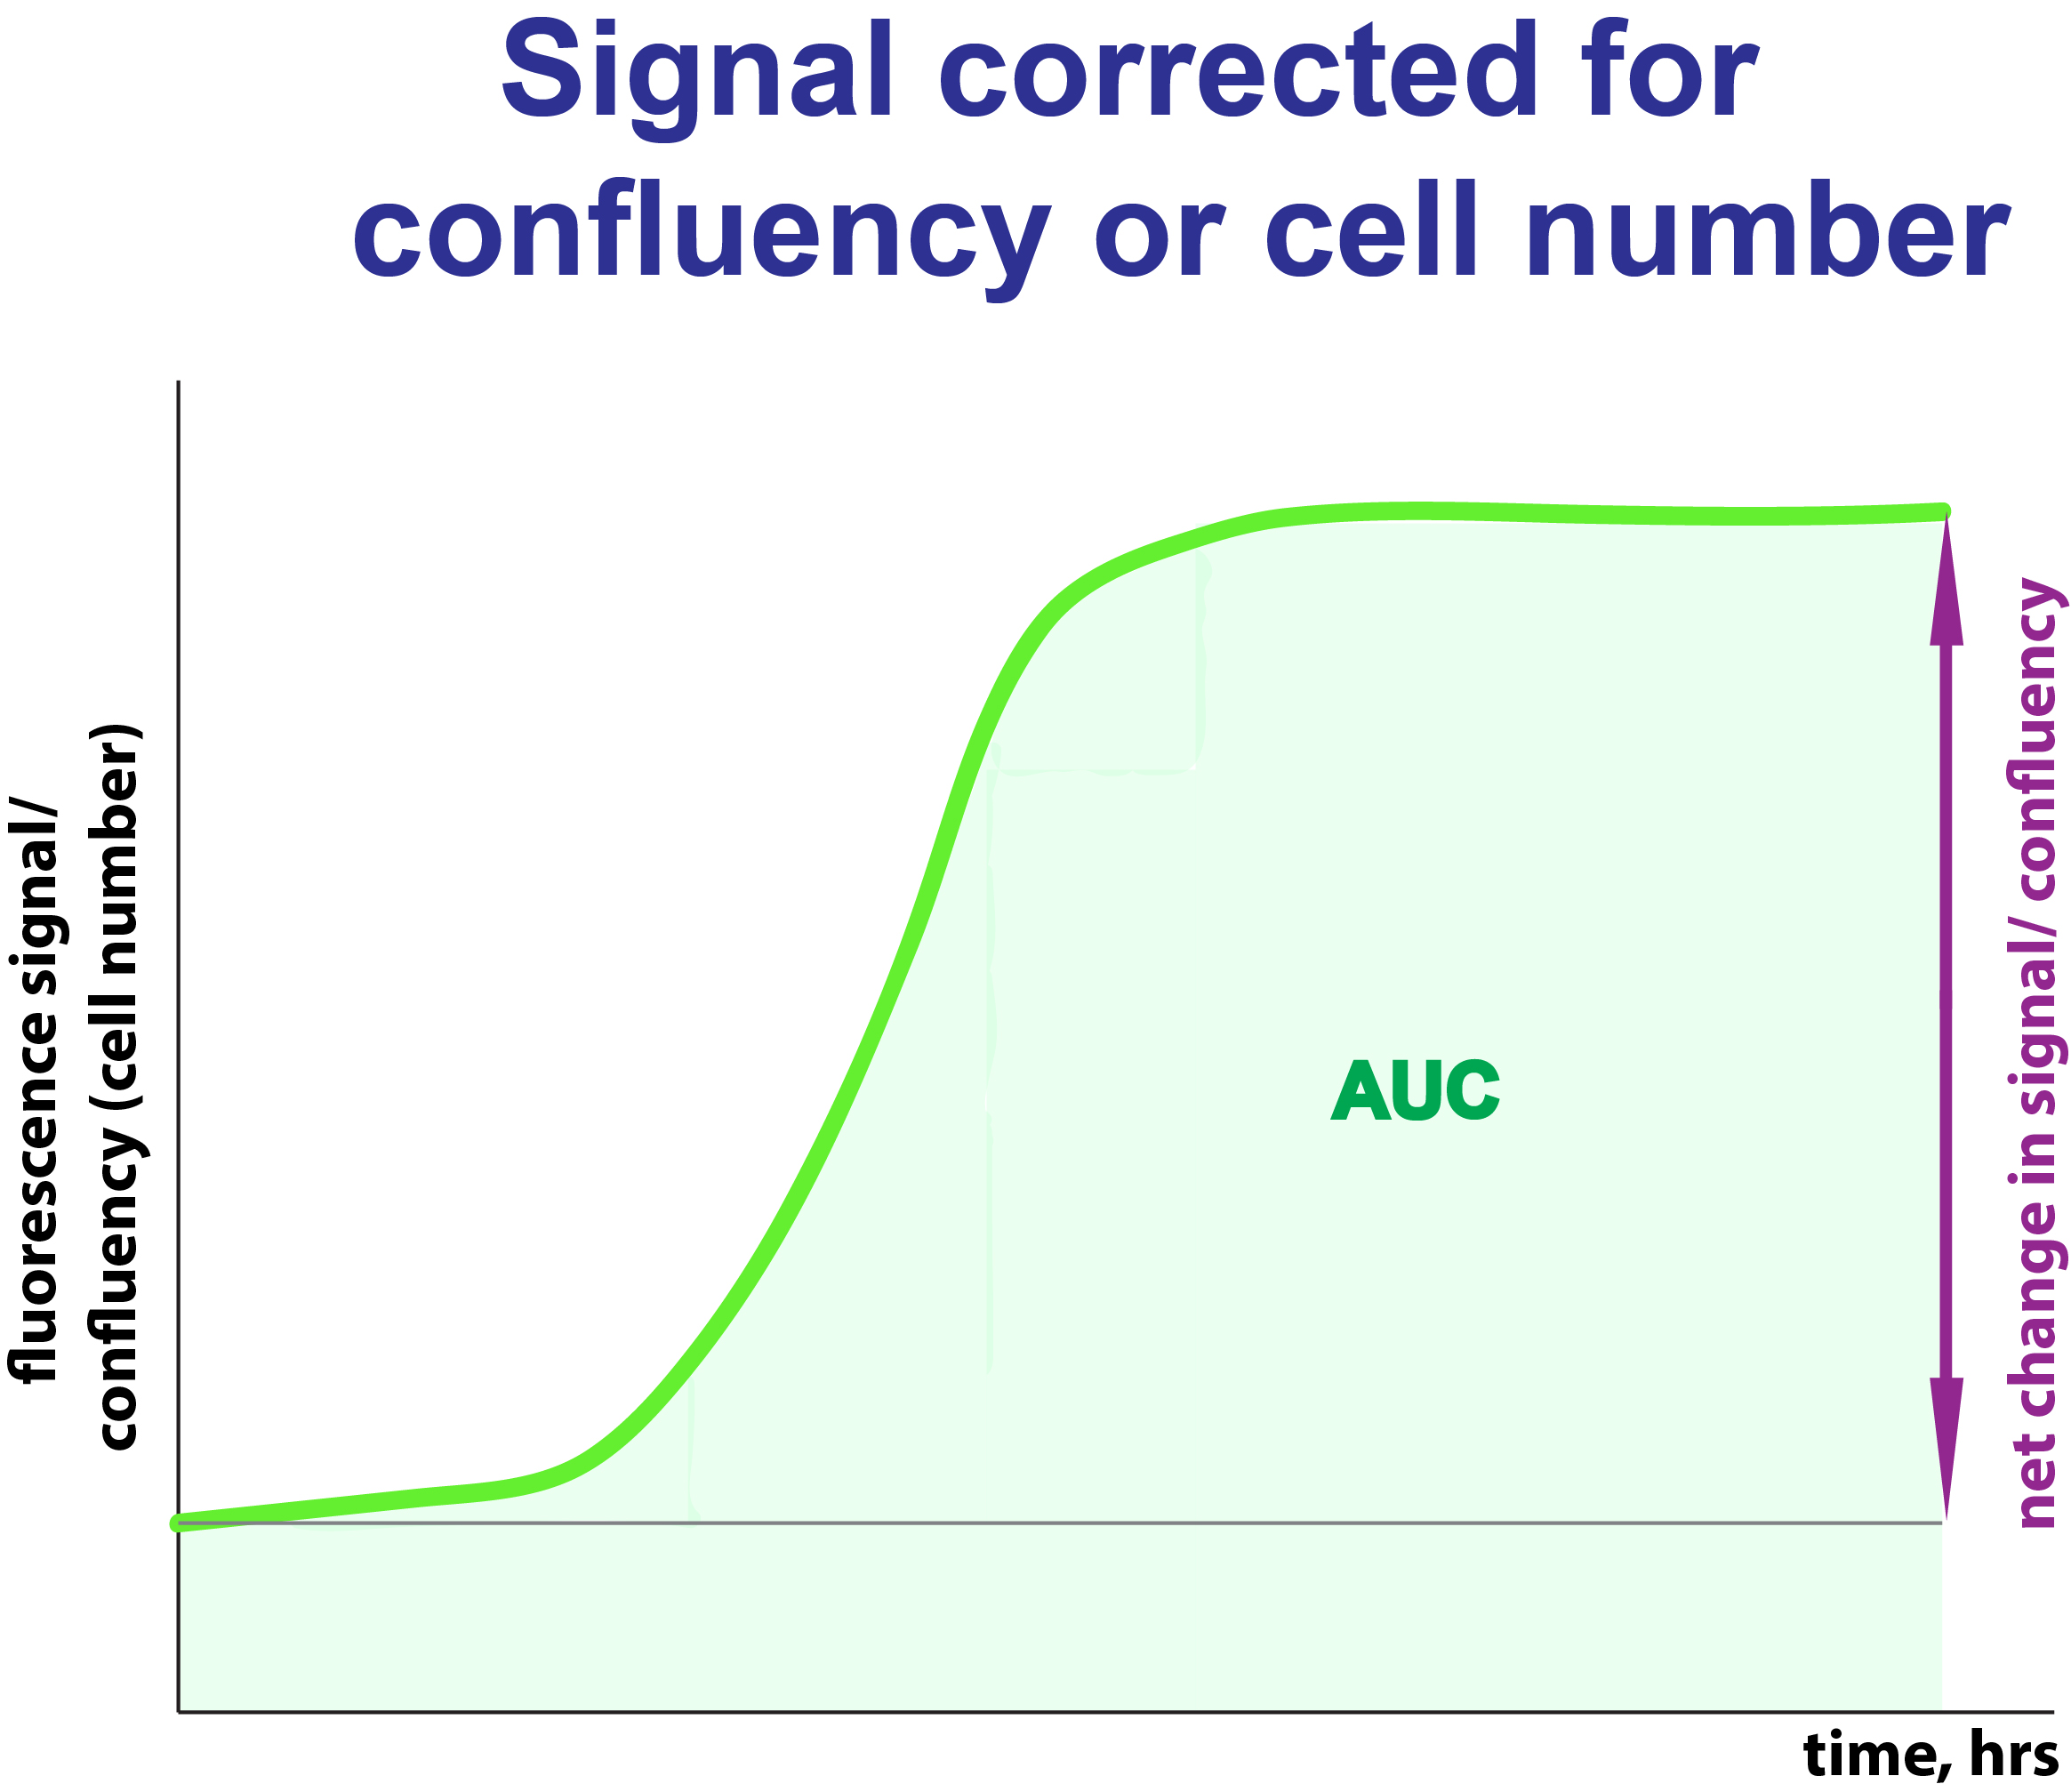
The estimated parameters:
AUC_exp_final: Area under curve estimated according to the spline fitting function
Net.change.final: a change over observation time in fluorescence signal corrected for cell confluency.
IC50 estimation
Estimation of growth properties of tumour cells is essential part of drug development in oncology. The IC50, a concentration of the experimental substance which inhibit cell growth by 50%, is the most widely used parameter in this field of research. Click on the image will take you to the application I wrote in R Shiny. The app takes raw data in Excel format and either automatically calculates IC50 values or enable a user to interactively examine the graphical data of growth suppression curve. Data preparation is described inside the application.
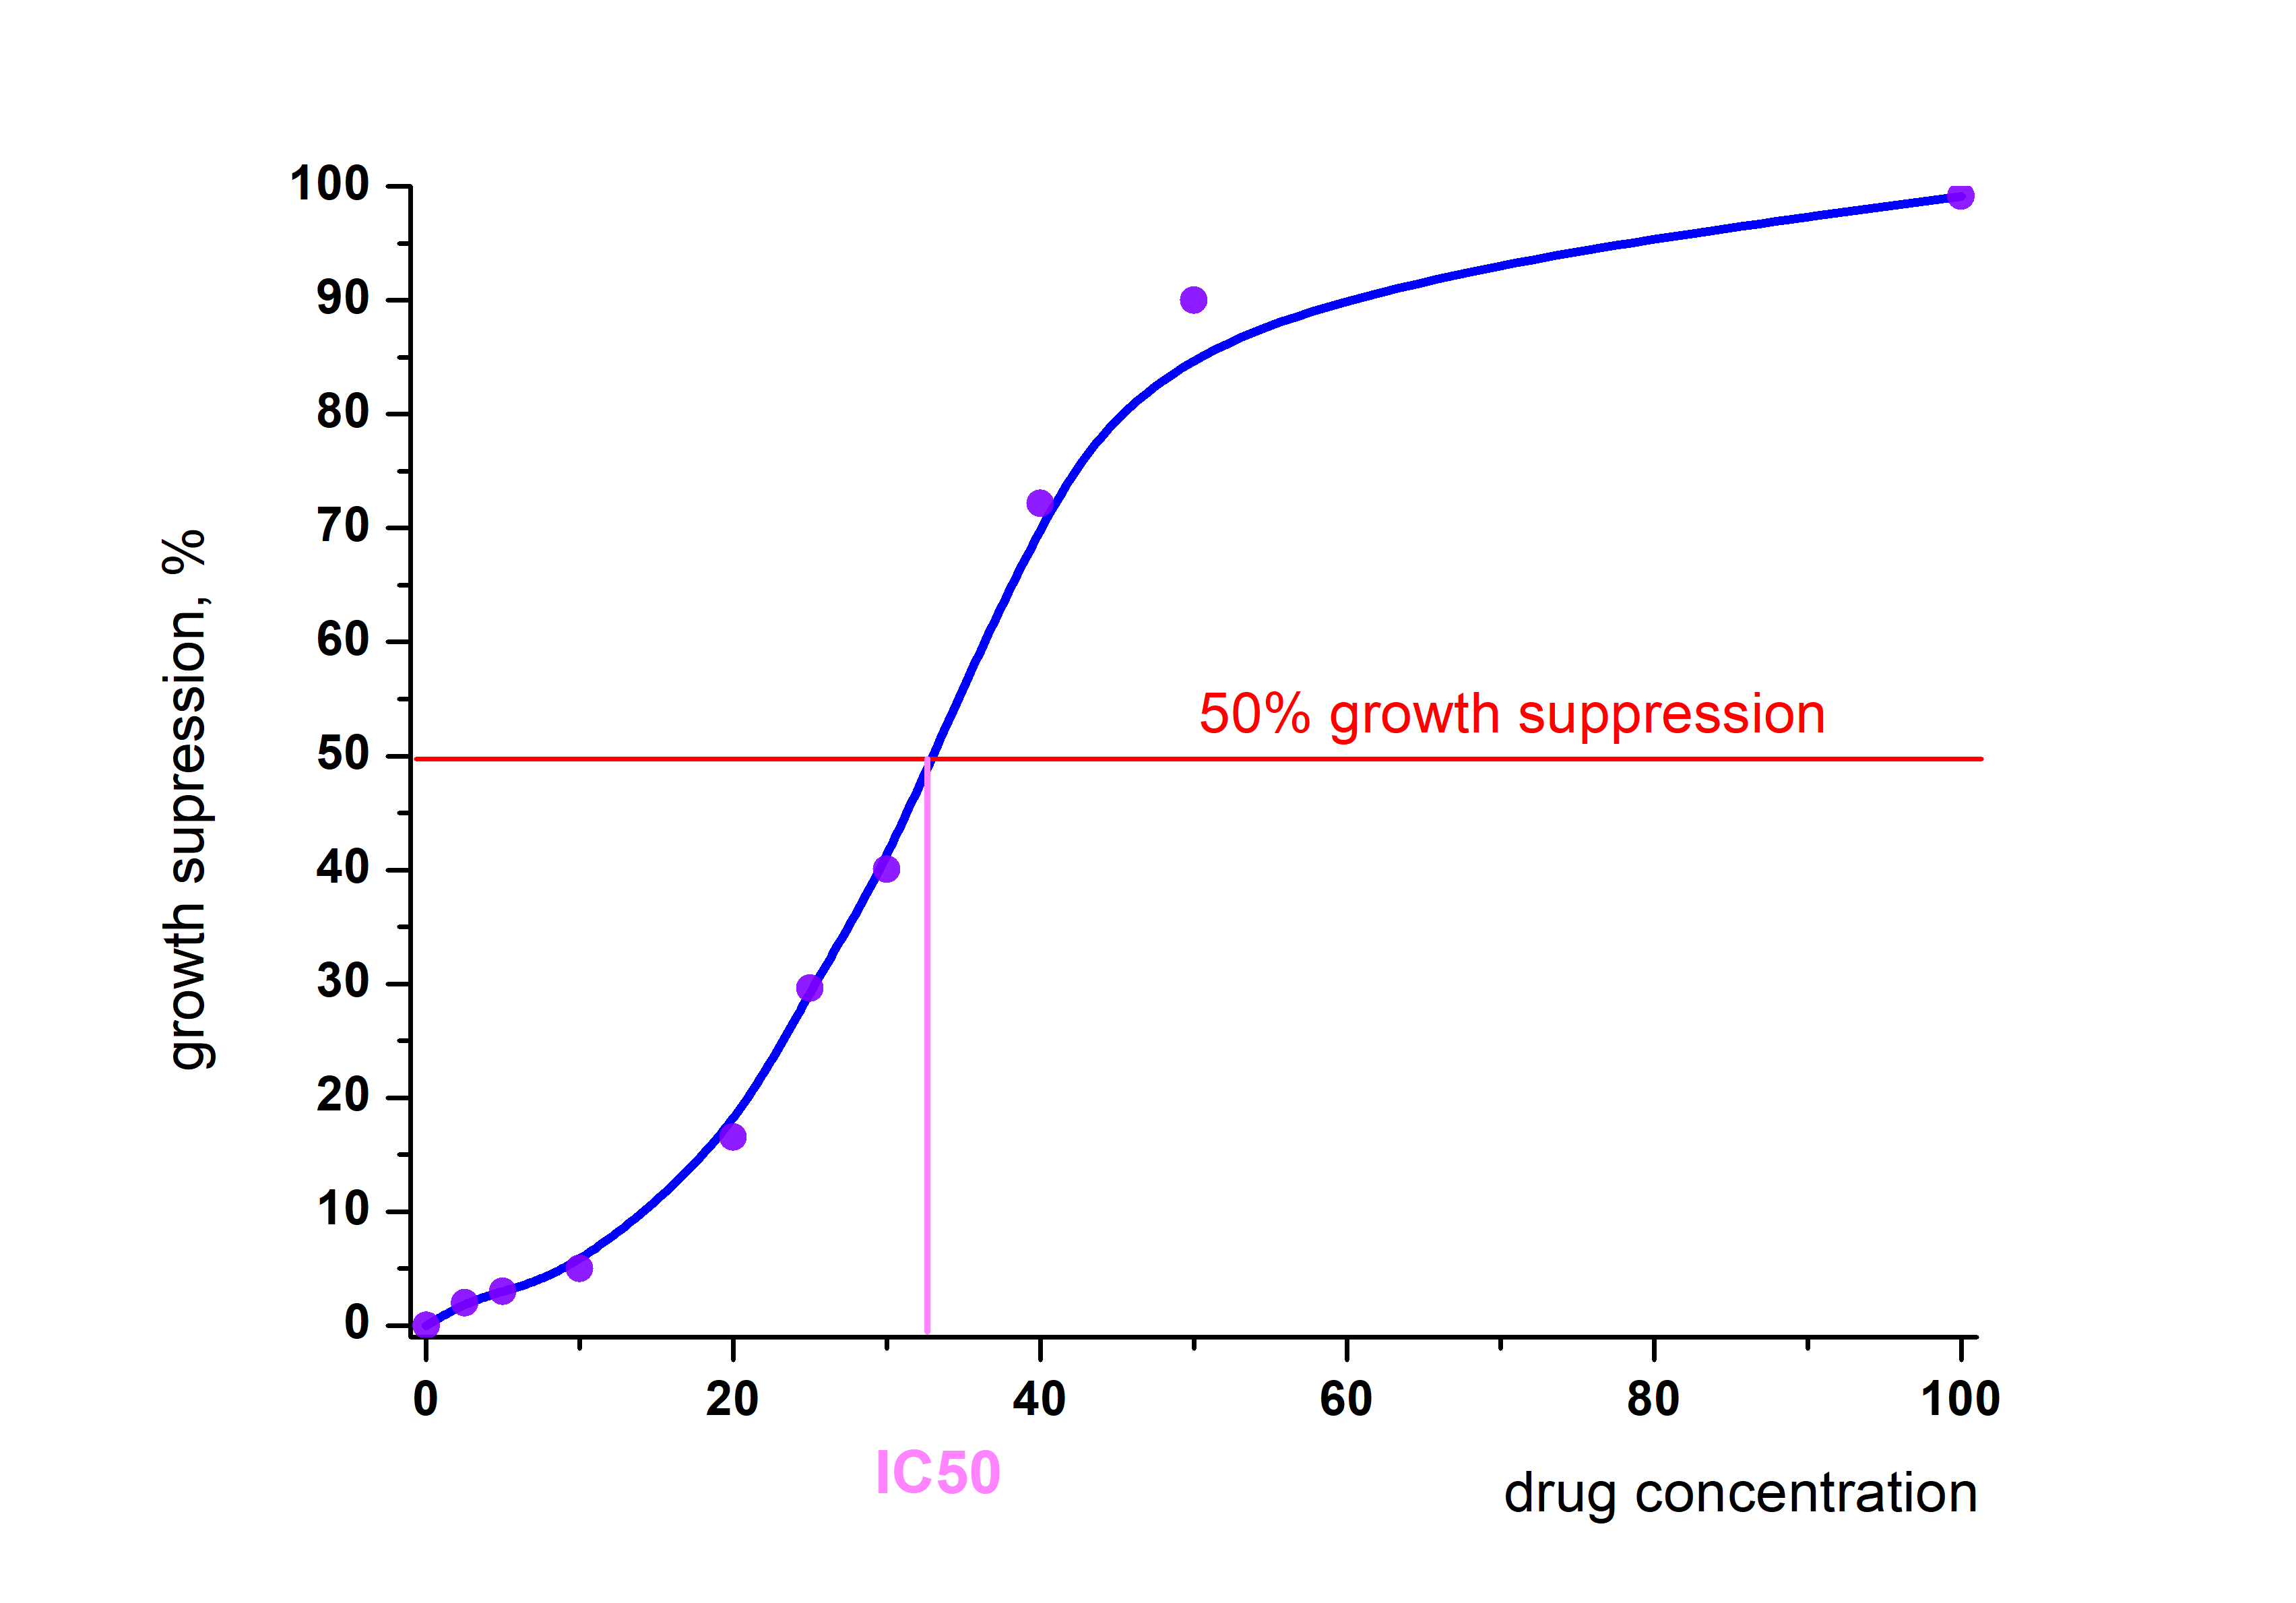
The estimated parameters:
IC50